
What Frequency Tables for categorical values in dataframe ?

Frequency tables are tables that shows how frequently various categories of categorical variables occur in data and how many different categories are there and which are those categories,  it is also useful for classification to find the frequency of each category of label variable(column) .  this help us to separate helpful categories from not so helpful categories. 

suppose some category in categorical variable occurs just ones or twice  then it is not going to be helpful from statistical point of view .

Lets see how to make frequency tables---


first i have downloaded auto_prices data set ,then i have taken out come categorical columns and created list of those columns ,this list along with dataset is passed to the count unique function . that function simply loop through each column in the list and  counts  number of times each unique value occurs in  column and finally prints the same.

above code gives following frequency table---
Examining classes and class  imbalances----
for classification problem frequency table help us understand how many categories are there in label column and also displace imbalances in categories if any are present. in below example bad credit is a label that we have to predict.
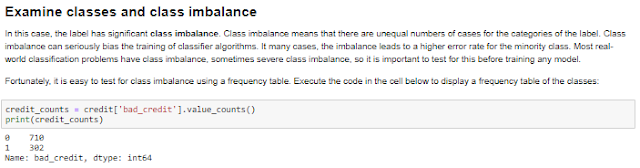

Comments

Popular posts from this blog

Feature Engineering is easy ..!!

Features are input to machine learning algorithm. and the row features that are provided to us are not the best, they are just whatever just has to be in data.  Feature engineering have a goal to convert given features into much more predictive ones so that the can predict label more precisely . feature engineering can make simple algorithm to give good results. at a same time if you apply the best algorithm and do not perform feature engineering well you are going to get poor results.  feature engineering is a broad subject people dedicate their entire careers to feature engineering. there are some steps in feature engg that we need to follow and repeat most of the times to get job done. steps--- 1. Explore and understand data relationships 2. Transform feature  3.Compute new features from other by applying some  maths on it 4. Visualization to check results   5. Test with ML model 6. Repeat above steps as needed Transforming feature--- Why transform featu...

Data preparation : Dealing with missing values

Missing values are probably the most common headache you are going to have as machine learning engineer. missing values are the ones who screw the whole algorithm and make model give wired results(predictions). Treating missing values--- 1. Use exploration to detect the missing values -- detecting missing values is crucial because  lot of machine learning models fail because of missing values. 2.Find how are missing values are coded-- missing values could be codded in the data in one or more of following formats.     -NULL     -a string or number--eg.-9999,0,"NA","?"etc. 3. Treatment strategy--     - if some column has lot of missing values then its better to get rid of that column.     - remove row-- suppose very few rows have missing values then remove those rows.     -Forward or backward fill-- sometimes its just better to use fill which work by filling value of  nearest           neighbou...

Data preparation: Treating errors and outliers

Errors are outliers are the those values in dataset which are far away from mean value of that column in which they exist or we can say they are very small or large as compared to other values in that column. suppose we are observing column of price and we see value that is ten times bigger then other values then it could be error or outlier. to identify either it is error or outlier we need to apply some domain knowledge or we can say field knowledge. outliers are mainly caused by variability in measurement or experimental errors. but sometimes they could be useful and help us understand data better if we apply domain knowledge. for example we find a outlier in car price of cars data set then we check its other features and we found  that that car is luxury car then we understand it was outlier but a useful one and it was not just a error. Dealing with errors/outliers--- 1. Detect errors/outliers -- use data exploration to identify errors /outliers 2. methods to identify errors a...